
You can make a chart in PowerPoint or Excel. If you have lots of data to chart, create your chart in Excel, and then copy it into your presentation. This is also the best way if your data changes regularly and you want your chart to always reflect the latest numbers. In that case, when you copy and paste the chart, keep it linked to the original Excel file.
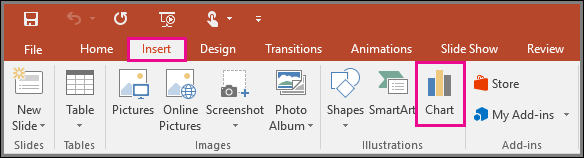
To create a simple chart from scratch in PowerPoint, click Insert > Chart and pick the chart you want.
1. Click Insert > Chart.
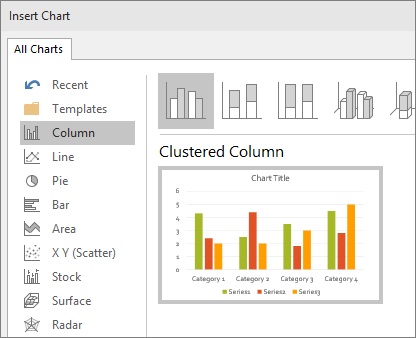
2. Click the chart type and then double-click the chart you want.
3. In the worksheet that appears, replace the placeholder data with your own information.

4. When you’ve finished, close the worksheet.

