
If you have already created a chart in Excel, you can embed and link it to your PowerPoint presentation. When you embed an Excel chart in PowerPoint, any updates you make to the original Excel chart will automatically update in your presentation, as long as the files remain in the same location. This helps the data stay in sync, so you won't have incorrect or out-of-date information in your chart.
To embed a chart from Excel:
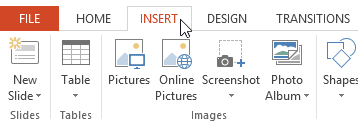
1. In PowerPoint, select the Insert tab.
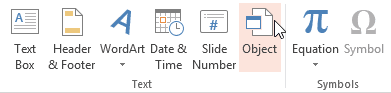
2. Click the Object command in the Text group.
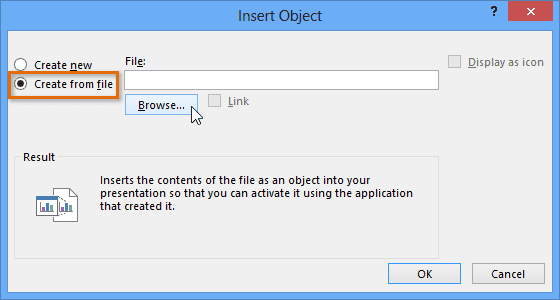
3. A dialog box will appear. Select Create from file, then click Browse.
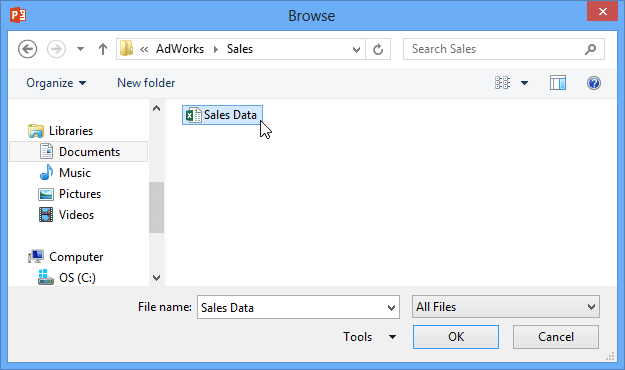
4. Locate and select the desired Excel file, then click Insert.
5. Check the box next to Link to file if you want to link the data to the Excel chart. This will enable your chart to update itself when changes are made to the Excel chart.
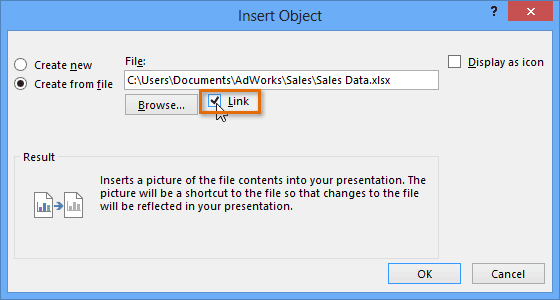
6. Click OK. The chart will now appear in your presentation.
To edit an embedded chart, double-click the chart. An Excel spreadsheet containing the chart's source data will appear. After you have finished editing, be sure to save the chart in Excel.
Once you have embedded a chart, be careful not to delete or move the original Excel file. If the location of either the PowerPoint presentation or the Excel file changes, you may have to embed the chart again in order for it to display correctly.
